
When you look at your website's overall conversion rate, you're looking at an average. And averages can be deceiving.
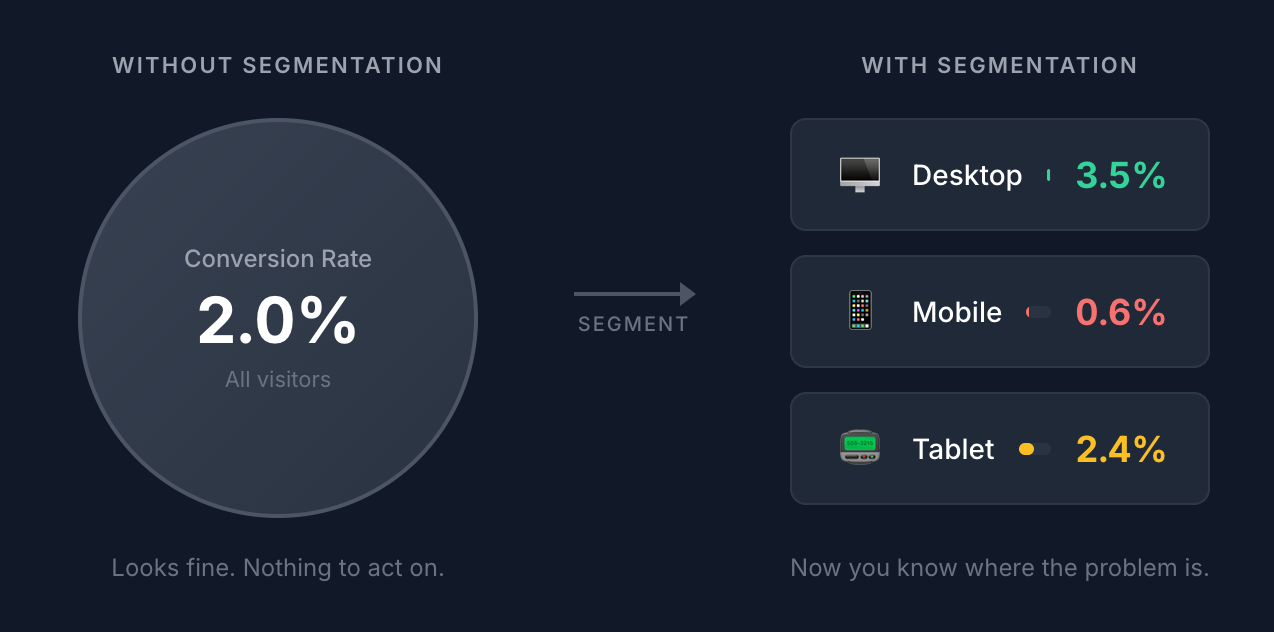
A 2% conversion rate might sound okay, until you realize it's actually 3.5% on desktop and 0.6% on mobile. Those aren't just different numbers. They're different problems that require different solutions.
And this is where visitor segmentation comes in.
Instead of looking at all your traffic as one big blob, you break it down into meaningful groups based on shared characteristics, like device type, location, and traffic source.
When you segment your data, patterns emerge that are invisible in the aggregate view. And those patterns point directly to opportunities you can act on.
In this post, I'll walk you through 19 specific ways to segment your visitor data, with real examples of what each segment can reveal.
Let's get into it.
Device & Technology Segments
The device someone uses to visit your website can shape their entire experience. A page that works beautifully on desktop might be frustrating on a phone. These segments help you spot those discrepancies.
1. Device Type (Mobile / Desktop / Tablet)
This is often the first place to look when something seems off with your conversion rate.
What it reveals: UX friction, responsive design issues, and where your audience actually browses.
Example insight: You notice that mobile visitors have a conversion rate 60% lower than desktop. That's a strong signal that your mobile checkout flow, form fields, or page load speed needs attention. And if 70% of your traffic is mobile but only 30% of your conversions come from mobile, you know where to focus.
2. Operating System (iOS / Android / Windows / macOS)
This goes a level deeper than device type and can surface issues you wouldn't otherwise catch.
What it reveals: Platform-specific bugs, audience demographics, and purchasing behavior differences.
Example insight: Say your data shows iOS visitors converting at nearly twice the rate of Android visitors. This could reflect differences in purchasing power between the two audiences, or it could indicate a bug in your Android experience. Either way, it tells you where to investigate—and potentially how to think about ad targeting.
3. Browser (Chrome / Safari / Firefox / Edge)
Different browsers render pages differently, and some are stricter about privacy and JavaScript execution than others.
What it reveals: Rendering issues, JavaScript compatibility problems, and privacy-related tracking gaps.
Example insight: When you segment by browser, you see that Safari users have noticeably lower conversion rates. Since Safari has stricter privacy defaults and blocks certain types of tracking, this might indicate a technical issue—or it might mean your tracking isn't capturing Safari conversions accurately. (This is one reason cookieless tracking matters.)
Geographic Segments
Where your visitors are located affects everything from language preferences to currency expectations to whether they can even buy from you. Location-based analytics help you understand the audience geography of your website.
4. Country
One of the most useful segments for understanding international demand.
What it reveals: Where your traffic is coming from, and whether you're capturing value from those visitors.
Example insight: You're getting significant traffic from Germany, but conversions from German visitors are near zero. That's a clear signal: you might have an opportunity if you translate your site, add Euro pricing, or at minimum, make sure your checkout process works for international customers.
5. Region / State
Useful for businesses with geographic limitations or regional variations in demand.
What it reveals: Regional patterns in traffic and conversions, and potential gaps in your service coverage.
Example insight: Looking at your state-level data, you notice strong traffic from a state you don't currently ship to. That's either a signal to expand your shipping, or an indication that you're wasting ad spend targeting an area you can't serve.
6. City
City-level data is most useful for local businesses or for understanding the impact of specific events.
What it reveals: Hyperlocal demand and whether events or conferences are driving traffic.
Example insight: You see a traffic spike from Austin during SXSW week. That tells you your event marketing or conference presence is working—and gives you data to justify (or increase) that investment next year.
7. Browser Language
This is often more accurate than country data for understanding language preferences.
What it reveals: What language your visitors actually prefer, regardless of where they're located.
Example insight: Checking this segment, you find that 12% of your US visitors have their browser set to Spanish. That's a meaningful audience that might benefit from Spanish-language content—even if your site is US-focused.
Traffic Source Segments
Not all traffic is created equal. A visitor from an email campaign behaves differently than one from a Google search or a social media link. These segments help you understand which sources are actually driving value.
8. Channel (Organic / Paid / Social / Direct / Referral / Email)
The broadest view of where your traffic comes from.
What it reveals: Which acquisition channels drive quality traffic versus just volume.
Example insight: Social media drives 25% of your traffic but only 3% of your conversions. That's not necessarily bad—it might mean social is an awareness channel, not a conversion channel. But knowing the difference helps you set realistic expectations and allocate budget accordingly.
9. Referrer
This tells you exactly which websites are sending you traffic.
What it reveals: Which specific sites send visitors who convert, and potential partnership opportunities.
Example insight: A niche industry blog you've never heard of is sending traffic that converts at 8%—way above your site average. That's a relationship worth nurturing, whether through guest posting, partnerships, or just making sure you don't lose that link.
10. UTM Source
When you tag your links with UTM parameters, you can get granular data on exactly where traffic is coming from within each channel.
What it reveals: Performance differences between specific platforms, newsletters, or partners.
Example insight: Your data shows traffic from Facebook converting at 3x the rate of traffic from LinkedIn for your product. That tells you where to focus your organic social efforts—and maybe where to cut back.
11. UTM Medium
This tells you what type of link or placement drove the traffic.
What it reveals: Which content formats and distribution methods work best.
Example insight: Email traffic converts at 6%, while paid social converts at 1.5%. Your email list is your highest-value asset—which might change how much you invest in list building.
12. UTM Campaign
This lets you measure the performance of specific marketing initiatives.
What it reveals: Which campaigns are actually driving results, not just clicks.
Example insight: Your educational webinar campaign drives fewer total visits than your promotional campaign, but converts at 4x the rate. That's useful for deciding what types of campaigns to run more of.
13. UTM Content
This UTM parameter is typically used to differentiate between different creatives or CTAs within the same campaign.
What it reveals: Which specific ad variations, email versions, or CTAs perform best.
Example insight: You find that your "Start Free Trial" button outperforms "Learn More" by 35% across multiple campaigns. That's a signal to update CTAs across your site, not just in ads.
Page-Level Segments
Which pages people land on, and how those pages perform, tells you a lot about what's working in your content and marketing.
14. Landing Page
The first page a visitor sees sets the tone for their entire session. Landing page analytics help you understand which entry points are most effective.
What it reveals: Which pages attract visitors and which ones actually convert them.
Example insight: A blog post you wrote six months ago converts visitors at 5x the rate of your other posts. That's a page worth promoting more heavily, optimizing for conversions, and using as a template for future content.
15. Specific Page
Beyond just entry pages, you can analyze how any page on your site performs across different traffic segments.
What it reveals: How individual pages perform for different types of visitors.
Example insight: Your pricing page has a 65% exit rate when visitors come from paid ads, but only a 30% exit rate from organic search. Paid visitors might not be qualified, or they might need more context before they're ready to see pricing—suggesting you should send paid traffic to a different landing page first.
Visitor Behavior Segments
Some of the most valuable segmentation comes from understanding visitor behavior patterns—specifically, whether someone has been to your site before.
16. New vs Returning Visitors
This is one of the most underrated segments in web analytics.
What it reveals: How well you're making a first impression, and how well you're retaining visitors.
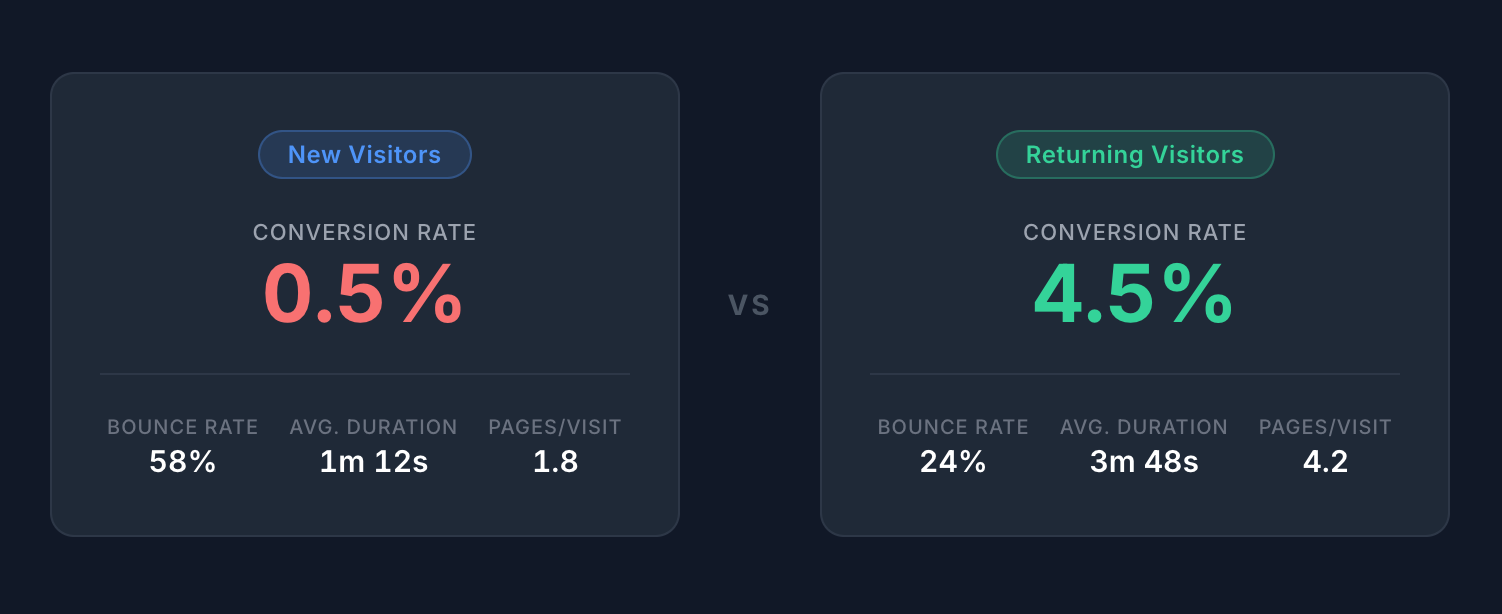
Example insight: New visitors convert at 0.5%, while returning visitors convert at 4.5%. This tells you two things: first, that getting visitors to come back dramatically increases your chances of converting them; and second, that investing in email capture or retargeting could have a significant payoff.
How to interpret the pattern: If your returning visitor conversion rate is low, the issue might be with your product or offer itself. If your new visitor conversion rate is low but returning visitors convert well, the issue is more likely your messaging or UX—people just need more time to trust you.
Time-Based Segments
When people visit can be just as important as where they come from.
17. Seasonality (Month / Quarter / Year-over-Year)
Looking at patterns over longer time periods helps you understand cyclical trends and plan accordingly.
What it reveals: Seasonal patterns in traffic and conversion behavior.
Example insight: You notice that traffic and conversions for your B2B app drop significantly during the last two weeks of December every year. That's a signal to pause your paid campaigns during that window rather than burning budget on traffic that won't convert. Wait until people are back from vacation.
Combined Segments
Here's where things get interesting. Individual segments are useful, but combining them often reveals insights you'd never find otherwise.
18. Device + Traffic Source
You already know from segment #1 that mobile converts worse than desktop. This combination tells you where the mobile problem actually is.
What it reveals: Which traffic sources have mobile-specific conversion problems.
Example insight: You filter to mobile visitors only and compare conversion rates across traffic sources. Mobile visitors from email convert at 3.1%, while mobile visitors from social convert at 0.3%. The issue isn't mobile in general—it's mobile from social specifically. Maybe your social landing pages aren't mobile-optimized, or social audiences on mobile are just browsing casually. Either way, you now know exactly where to focus.
19. New Visitors + Traffic Source
This tells you which channels are best for acquisition specifically—not just overall traffic, but bringing in people who've never seen your brand before.
What it reveals: Where your new customers are actually coming from.
Example insight: Organic search brings in new visitors who convert at 4x the rate of new visitors from paid ads. Your SEO investment is paying off, and your paid targeting might need refinement.
Putting This Into Practice
Obviously, nineteen segments is a lot, and you don't need to analyze all of them at once. That would be overwhelming and probably not useful.
So here's a more practical approach:
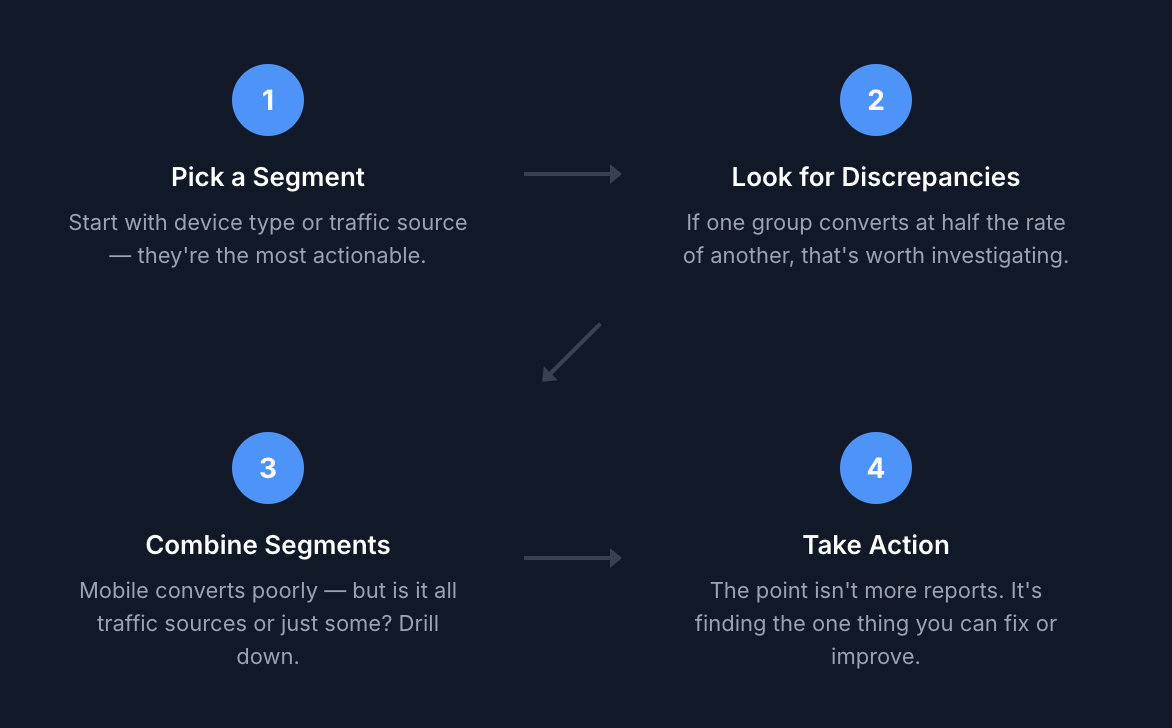
Start with one or two segments. Device type and traffic source are usually the most immediately actionable. Look for large discrepancies—if one segment converts at half the rate of another, that's worth investigating.
Make sure you have enough data. A segment with 50 visitors isn't going to tell you much. Wait until you have enough volume in each group for the numbers to be meaningful.
Combine segments when you have questions. If you see that mobile converts poorly, the next question is whether that's true across all traffic sources or just some. Combining segments helps you drill down.
Focus on decisions, not just data. The point of segmentation isn't to create more reports. It's to find the one thing you can fix or improve.
Start Segmenting Your Data
GoodMetrics has dedicated reports for most of the segments we covered, so your data is already broken down when you open them. And when you want to combine segments, filters let you drill deeper with a single click.
So if you want to start uncovering what your aggregate data is hiding, give GoodMetrics a try.