
If you switched to GA4 and your bounce rate suddenly dropped by 20%, you didn't fix anything. Google just changed the definition.
This is one of the most common sources of confusion in web analytics right now. Marketers who tracked bounce rate for years in Universal Analytics are now staring at a metric with the same name that measures something completely different.
In this post, we'll break down exactly what changed, where to find bounce rate in GA4, how the new formula works, and why the new approach frustrates so many people.
The Old vs. New Bounce Rate Definition
In Universal Analytics, bounce rate was straightforward: the percentage of sessions where a visitor landed on a page and left without any further interaction. No second pageview, no event, nothing. Time on page didn't matter at all. Someone could spend 10 minutes reading your blog post, leave, and it still counted as a bounce.
GA4 flipped this on its head.
In GA4, bounce rate is defined as the percentage of sessions that were not engaged. It's the inverse of a new metric called engagement rate:
GA4 Formula
Bounce Rate = 1 − Engagement Rate
This means if your engagement rate is 65%, your bounce rate is 35%. They always add up to 100%.
The practical result: GA4 bounce rates are almost always 15–30 percentage points lower than what the same site showed in Universal Analytics. A site that used to show a 60% bounce rate might now show 35–40% in GA4. The traffic didn't change. The definition did.
| Universal Analytics | GA4 | |
|---|---|---|
| Definition | % of single-page sessions with no interactions | % of sessions that were not engaged |
| Time on page matters? | No | Yes (10-second threshold) |
| Conversions affect it? | Only if tracked as events | Yes, any key event prevents a bounce |
| Typical range | 40–70% | 25–50% |
| Shown by default? | Yes | No (must be added manually) |
If you're comparing year-over-year bounce rate data across the UA-to-GA4 transition, stop. The numbers are not comparable. You'd be comparing two completely different metrics that just happen to share a name.
What Is an Engaged Session in GA4?
Since GA4 bounce rate is built on engagement rate, you need to understand what GA4 considers an "engaged session."
A session counts as engaged if it meets any one of these three criteria:
- Lasted 10 seconds or longer. The visitor stayed on your site for at least 10 seconds.
- Had 2 or more page views. The visitor navigated beyond the landing page.
- Triggered a key event. The visitor completed a conversion action (a purchase, a form submission, or any event you've marked as a key event).
It's an OR condition, not AND. Meeting just one of these is enough for the session to be considered engaged, which means it won't count as a bounce.
The 10-Second Threshold
This is the biggest change from Universal Analytics. In UA, a visitor who spent 8 minutes reading your blog post and then left still counted as a bounce. In GA4, that same visitor would be engaged (they exceeded the 10-second threshold by a wide margin).
The 10-second default is configurable. You can change it to anywhere from 10 to 60 seconds in your GA4 settings:
- Go to Admin in the left sidebar
- Under your property, click Data Streams
- Select your stream
- Click Configure tag settings
- Click Adjust the session timeout settings (you may need to click "show more" to see this option)
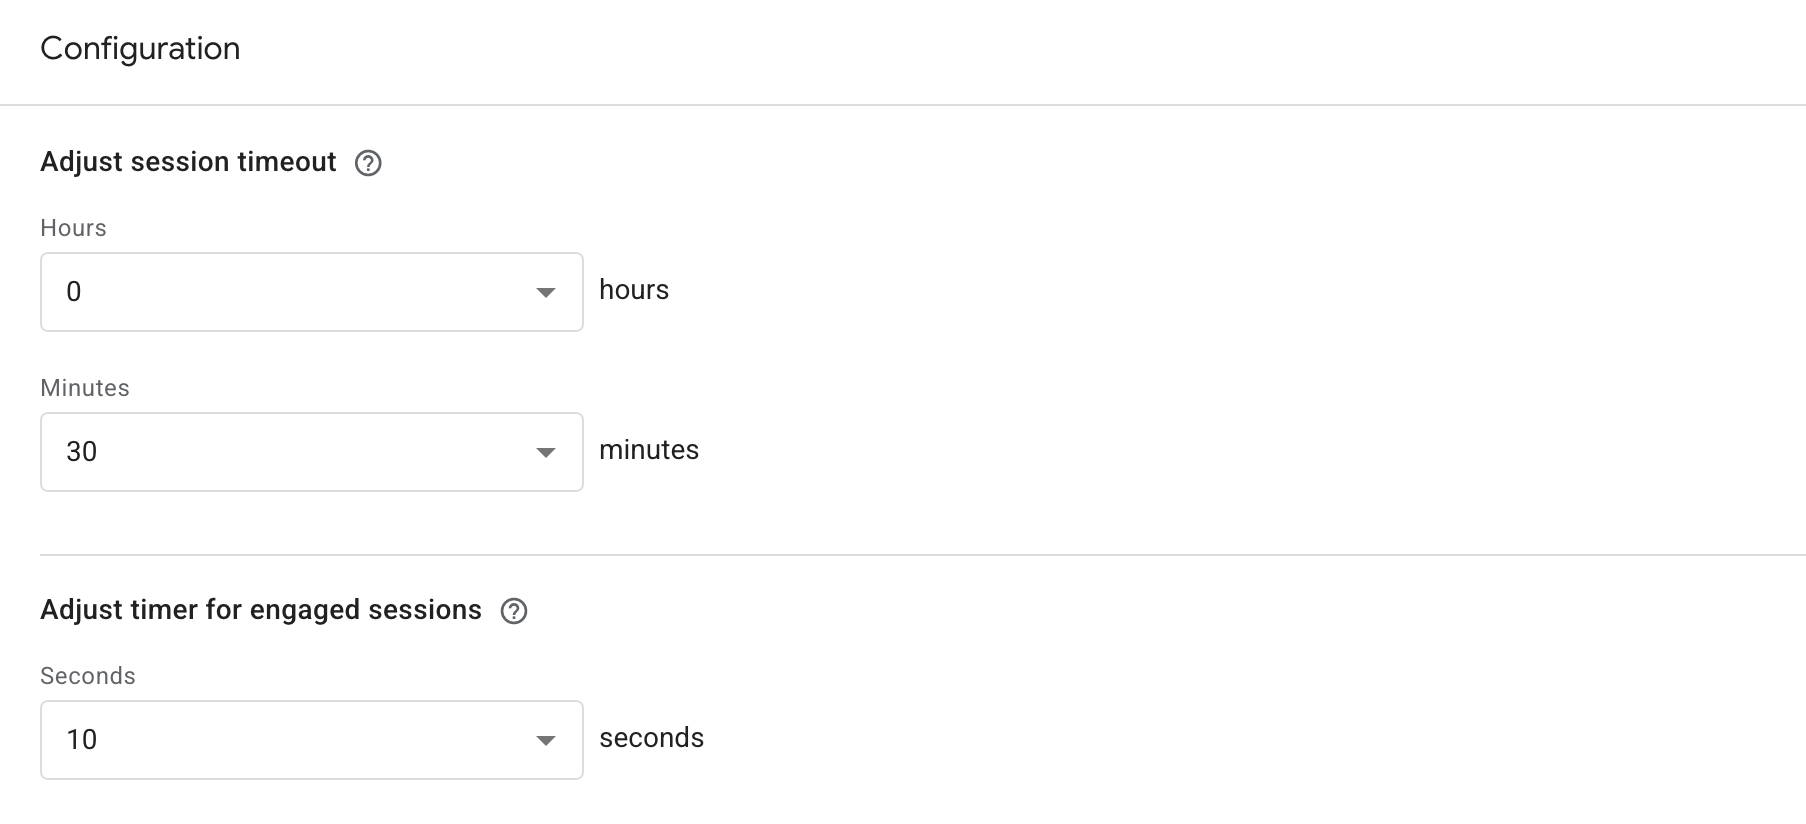
Most users never change this, and most don't even know they can. For content-heavy sites, bumping it to 20 or 30 seconds might give you a more meaningful picture of engagement. For e-commerce sites where users make quick decisions, the 10-second default is usually fine.
Just keep in mind: changing this threshold affects data going forward only. It won't recalculate historical data.
Where to Find Bounce Rate in GA4
Here's something that catches most people off guard: bounce rate is not visible in GA4 by default. Google removed it from standard reports and only brought it back as an optional metric after significant user backlash.
You have to manually add it to every report where you want to see it.
In Standard Reports
- Navigate to Reports in the left sidebar
- Open any report (e.g., Life cycle > Acquisition > Traffic acquisition)
- Click the pencil icon in the upper right to customize the report
- Click Metrics
- Click Add metric
- Search for "Bounce rate" and select it
- Click Apply, then Save
You'll need to repeat this for each report. Adding bounce rate to one report does not add it to others.
In Explorations
- Go to Explore in the left sidebar
- Create a new exploration (Free Form works well)
- In the Variables column, click + next to Metrics
- Search for Bounce rate and add it
- Drag it into your report
Via the GA4 API
If you're pulling data programmatically, bounce rate is available as the bounceRate metric in the GA4 Data API. It returns a value between 0 and 1 (so 0.45 means 45%).
How GA4 Calculates Bounce Rate
Let's walk through the math with a concrete example.
Say your site had 1,000 sessions last month. Of those:
- 620 sessions lasted more than 10 seconds
- 180 sessions had 2+ page views (some overlap with above)
- 50 sessions triggered a key event (some overlap with above)
After removing overlaps, 700 unique sessions met at least one engagement criterion.
Step 1: Engagement Rate
Engagement Rate = 700 / 1,000 = 70%
Step 2: Bounce Rate
Bounce Rate = 1 − 0.70 = 30%
In Universal Analytics, the same 1,000 sessions might have shown a 55% bounce rate because UA didn't care how long visitors stayed. A visitor who read your page for 2 minutes and left without clicking anything was a bounce in UA, but is engaged in GA4.
This is why your numbers changed. The underlying behavior is the same. The measurement changed.
The Problem with GA4's Approach
Even if you think GA4's engagement-based model is an improvement, the rollout created real problems that are still causing headaches.
The same name, a completely different metric. Calling it "bounce rate" when it measures something fundamentally different than what bounce rate meant for 15+ years was a recipe for confusion. Stakeholders who see bounce rate drop from 60% to 35% think performance improved when it didn't. The ruler changed.
Historical comparisons are broken. If your organization tracked bounce rate trends for years, that continuity ended with the UA-to-GA4 migration. There's no clean way to reconcile the two definitions, so years of benchmarking data became less useful.
Hidden by default. Even after reintroducing bounce rate, Google buried it. Users have to customize every individual report to see it. This means many GA4 users don't even know bounce rate exists in their reports.
The 10-second threshold is arbitrary. Is a visitor who stays for 9 seconds meaningfully different from one who stays for 11 seconds? GA4 says yes. One is a bounce, the other is engaged. The threshold is configurable, but since most users don't know that, the default shapes everyone's data.
"Engaged" doesn't mean "satisfied." A session that lasts 12 seconds and ends with the visitor leaving frustrated isn't really a success, but GA4 counts it as engaged. The metric tells you whether something happened, not whether it was valuable.
Bounce Rate in Looker Studio
If you use Looker Studio to report on GA4 data, bounce rate is available as a pre-built metric through the native GA4 connector. No custom calculations needed. You can add it to any table, chart, or scorecard, and it uses the same GA4 definition (1 − engagement rate).
What Is a Good Bounce Rate in GA4?
Since GA4 changed the definition, the old benchmarks don't apply anymore. As a general rule, GA4 bounce rates run roughly 15–30 percentage points lower than what the same site showed in Universal Analytics. So if you're used to seeing 55–65% in UA, expect something in the 30–40% range in GA4 for the same traffic.
For detailed bounce rate benchmarks by industry and page type, check out our bounce rate glossary page — just keep in mind that most published benchmarks are still based on the Universal Analytics definition.
Don't get too fixated on hitting a specific number. A 50% bounce rate on a blog post is fine if visitors are reading your content and finding value. A 25% bounce rate on a product page might still be a problem if nobody is adding to cart. Context always matters more than the number itself.
Wrapping Up
GA4 didn't remove bounce rate — it redefined it. Bounce rate now means the percentage of sessions that weren't engaged, where "engaged" means the session lasted at least 10 seconds, had 2+ page views, or triggered a key event. This is why your bounce rate dropped when you switched from Universal Analytics.
The key things to remember:
- GA4 bounce rate = 1 − engagement rate. They always add up to 100%.
- It's hidden by default. You need to manually add it to each report in GA4.
- Old benchmarks don't apply. GA4 bounce rates run 15–30 points lower than UA.
- The 10-second threshold is configurable under Admin > Data Streams > Configure tag settings.
- Don't compare UA and GA4 bounce rates. They measure different things despite sharing a name.
If all this feels unnecessarily complicated, that's because it is. Bounce rate should be a simple metric that tells you whether your content is working, not a puzzle that requires customizing reports and memorizing redefined formulas.
That's exactly why we built GoodMetrics. It gives you clear, actionable engagement metrics out of the box — no hidden settings, no redefined terminology, no digging through menus. If you're ready for a simpler approach to understanding your website traffic, start a 30-day free trial.